


")


What if you could consistently create new business where there is little to no competition? In this article I’ll explain the 5 easy steps to creating new ideas that help you lead your business out of the red competitive waters and into a new space where the competition is irrelevant – your own blue ocean.
Introduction to Blue Ocean Strategy
The term “Blue Ocean” stems from the idea that there are opportunities in each industry to move from the ultra competitive battles around price and features (red ocean) into a new market reality where your typical competitors are either non-existent or irrelevant. To enable this new scenario, you must first understand exactly how value is created in your customers lives by creating a “strategy canvas.” To make this explanation easier, I’m going to be using an excel template I created. You can download a copy for $19 by clicking below:

FREE VIDEO TRAINING FOR INNOVATORS
Over 100 Slides Free and Downloadable as a PDF

Step 1: Create A Strategy Canvas
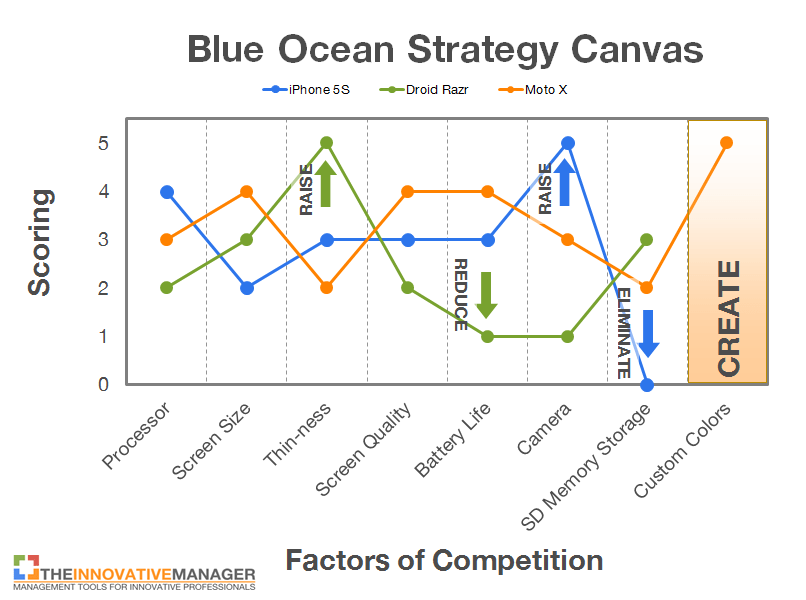
A strategy canvas is the most fundamental tool used in the Blue Ocean Strategy framework. It is designed to give you an immediate snapshot of how your business/product/service stacks up against the competition. To get started, first list the products (or services) you want to compare. In this example, I’m going to compare the following smartphones:
- iPhone 5S
- Droid Razr
- Moto X
If you’re following along with the Excel template, open the first worksheet labeled “Blank Template” and after you’ve filled in the data, this is what it should look like:

The next thing to do is list the attributes, or factors of competition, that those products compete on. For this example, I’m going to list the following attributes of smartphones:
- Processor
- Screen Size
- Thin-ness
- Screen Quality
- Battery Life
- Camera
- SD Memory Storage
In the spreadsheet, this list goes in the column on the left of the screen and should look like this:

Keep in mind that though this list is mostly about specifications in this example, often times other parameters that provide value to the customer should be included such as speed of service, customer support, delivery time, etc. The list of attributes should have all the major value drivers in a product or service. For this example I stuck with mostly specifications for simplicity. Also notice that each attribute should be listed as if from the customer perspective. For example, notice how I used the attribute “Thin-ness” rather than “Thickness.” The reason I did that is because “thin-ness” is what provides value to the consumer, not thickness. And if I had used thickness rather than thin-ness, my rating scale, which I talk about below, would have been messed up because having a higher thickness score is bad but having a higher thin-ness score is good. So it’s important to keep these details straight. This is also why I often use the term “affordability” rather than price. Affordability is valuable to the customer. Price is meaningless.
The next step in creating the strategy canvas is to rate each product from 0-5 (any scale is fine but I like to use 0-5) according to each attribute. Ideally you would have customer survey data to back up these ratings and ensure the ratings were not heavily influenced by your own biases. But in cases where this analysis is intended as more of a rough estimate rather than a scientific ranking, I’ve found that as long as you are quite familiar with your products and your competitors products, ranking these yourself is good enough to start with. In this example, I chose to rate the smartphones as follows:

I won’t go into detail as to why I ranked these the way I did. My intention is not to start some Apple/Android flame war in the comments but for the sake of illustration, let’s assume these ratings are fairly representative so we can move on to the next step.
All we need to do now is create the canvas by combining this table data into a graph. In the Excel template, the graph should show up automatically in the next tab (or worksheet) titled “Blank Graph.” It will look like this:

And now you have a brand new strategy canvas! This is great, but we’re not done yet.
What we’ve created is a simple comparison of what is. But what if you want to create a comparison of what could be? To do that, we need to manipulate the strategy canvas.
According to the authors of the book “Blue Ocean Strategy,” Kim and Mauborgne teach that the pathway to successful innovation lies in doing a unique combination of one to four things to the attributes of your product, namely:
- Raise
- Reduce
- Eliminate
- Create
Let’s break these down as the next four steps in the process of innovation:
Step 2: Raise An Attribute
Continuing the smartphone example, back in 2011, Motorola wanted to capitalize on the storied Razr brand of old by creating the worlds thinnest smartphone. Toward the end of the year, they announced the Droid Razr – a 7mm thin smartphone. This was quite the engineering feat because at the time most smartphones were hovering around 9-15mm. From a blue ocean perspective, Motorola essentially “raised” the thinness of their design to a level previously unheard of for premium smartphones and solidified a competitive edge for that product. Though Motorola engineers may or may not have used the strategy canvas to come up with this idea (they probably just wanted to repeat the success of the original Razr flip phone), if they had used it they would have quickly identified their competitive position in the market and recognized ways they could stand above the crowd of smartphone releases.
The resulting value curve would look something like this:

The iPhone is another example of using “raise” to gain a competitive edge. With every mid-cycle refresh of their iPhone models – when they add an “S” to the model – they seem to usually focus on, among other things, vastly improving the camera on the device. I’ve owned both the Droid Razr and an iPhone 4S and the camera on the iPhone 4S was remarkably good compared with the Razr and other devices I’ve used. What attributes would you “raise” with your product or service?
Step 3: Reduce An Attribute
In some cases, especially with regard to disruptive situations, reducing the performance level of a particular attribute is the right strategy. This is where the smartphone example illustrates a design trade-off decision. For most smartphones the objective is to maximize battery life. However, what if you decided to prioritize that objective lower than the objective to make the phone as thin as possible? The result of that question would be that you would end up “raising” the thinness of the phone at the expense of the life of the battery. This is not the most desirable conclusion to reach but may still yield a market advantage if you can claim the world’s thinnest smartphone like Motorola did in 2011.
This is the value curve with the reduced attribute labeled:

If you think about the idea of reduction in light of disruptive innovation you start to see an interesting corollary. In disruptive innovation a product reaches a point where it is overserving the majority of its intended users. If you can identify the specific features or benefits that are overserved, using Blue Ocean strategy canvas you will know which feature or benefit to reduce and what the overall product/benefit profile should look like. To me, this is a fascinating use of the two frameworks and I will plan to explore this in later detail.
Step 4: Eliminate An Attribute
Sometimes the best thing to do with an existing idea is eliminate elements and think through what could emerge. In the smartphone example, Apple decided to completely eliminate the SD card slot. But the idea of removing an SD slot isn’t a very game changing innovation. However, when you start to think about what Apple eliminated when they first introduced the iPhone – namely the physical keyboard – that was a significant step.
Here’s a value curve with the elimination of an SD card identified:

Another example of eliminate would be Redbox. For a time, Blockbuster ruled the movie rental business by having a nationwide brick-and-mortar store presence. This wide distribution was credited for the company’s success and the main reason it was hard for other rental businesses to compete. However, by the late 90’s and early 2000’s, Redbox had decided that brick-and-mortar stores were not needed and instead focused on the idea of distributing rentals through vending machines. They basically eliminated the store and created a new value driver with the DVD vending machine. Later on companies like Netflix and Amazon took the idea of eliminate one step further by offering rentals online.
The most important thing about the idea of eliminate is to think through it with a clean slate perspective. In other words, don’t get caught in the trap of thinking that you must leverage your existing resources with every new idea. The reason this is a trap is because new startups don’t have those constraints and often can come up with vastly better ideas that ignore existing business models or resources. In Blockbuster’s case, they may have thought of new ideas such as DVD vending but didn’t want to pursue them because doing so would cannibalize their existing business model. Blockbuster may have had many good ideas surface at their company but chose not to pursue them because doing so would ignore their brick-and-mortar presence and all the resources and capital they had tied up in those resources.
Step 5: Create An Attribute
Another tool in the Blue Ocean strategy framework is the idea of creating a new value driver for the product or service in question. Back to the smartphone example, when Google announced the Moto X in 2013, it offered something that had never been done before with smartphones – complete color customization. Previous phones usually came in either one or two colors at the most. With the Moto X, anyone could go online and choose their own color scheme which would then be manufactured to those specifications in Texas then shipped out from there. The max period of time from placing the order to getting the phone was promised to be 6 days. By allowing customers to customize their phone’s colors according to their specific preferences, Google in essence created a new way for smartphones to provide value. By doing so, they essentially made themselves the only option in the market for that particular value proposition. Instead of competing on specs, features or price, Google created a “blue ocean” for themselves by enabling consumers to experience something completely new and different.
Here’s an example value curve for just the Moto X smartphone:

Below is a summarized strategy canvas for the smartphone example:
Conclusion
With Blue Ocean strategy, innovators are able to systematically think through ways to create value for their target customers versus the competition. Obviously with each idea generated, more analysis would be necessary to validate whether those specific ideas were valuable to customers but the Blue Ocean Strategy approach provides a fast and analytical approach to ideation and innovation.
12 Steps to Creating A New Innovation From Scratch - FREE Video Training
Over 100 Slides Free and Downloadable As A PDF


this helps so much!